Characterization of Visual Stimuli using the Standard Display Model
Joyce E. Farrell 1
Haomiao Jiang 1
Brian A. Wandell 1,2
1 Department of Electrical Engineering
2 Psychology Department
Stanford University, Stanford, CA 94305
Corresponding author: J.E. Farrell, joyce_farrell@stanford.edu
Key Words: Display technology, calibration, modeling, simulation, visual stimuli, psychophysics, pixel point spread function, spectral power distribution
Introduction
Human vision science advances by experiments that measure how sensations and perceptions arise from carefully controlled visual stimuli. Progress depends in large part on the type of display technology that is available to generate visual stimuli. In this chapter, we first describe the strengths and limitations of the display technologies that are currently used to study human vision. We then describe a standard display model that guides the calibration and characterization of visual stimuli on these displays (Brainard et al., 2002; Post, 1992). We illustrate how to use the standard display model to specify the spatial-spectral radiance of any stimulus rendered on a calibrated display. This model is used by engineers to assess the tradeoffs in display design, and by scientists to specify stimuli. The ability to quantify the stimulus is essential for reproducible research and to support the development of image-computable vision models. Finally, we discuss trends for new display systems that integrate light generation with optics, sensors, and computation. Calibrating and characterizing such systems will require extending the standard display model through digital twin simulation, advancing both technology and science.
Display technologies for vision science
An ideal display system for science and commerce would deliver the complete spectral, spatial, directional, and temporal distribution of light rays, as if these rays were generated by a real three-dimensional scene. The full radiometric description of light rays in the three-dimensional scene is called the “light field” (Gershun, 1939). For vision science, the simplified and related stimulus is the portion of the environmental light field that is incident at the cornea - this is the only part of the stimulus that the retina encodes. The incident light field changes as the head and eyes move.
Most displays fall short of reproducing the incident light field and lack the capability to dynamically adjust the displayed image in response to an observer's head and eye movements. Despite these limitations, modern displays create a very compelling perceptual experience that captures many important perceptual elements of a real three-dimensional scene. The ability to control these displays with computers that have digital frame buffers and graphics cards has greatly enlarged the range of stimuli used in visual psychophysics compared to the optical benches and tachistoscopes used by previous generations.
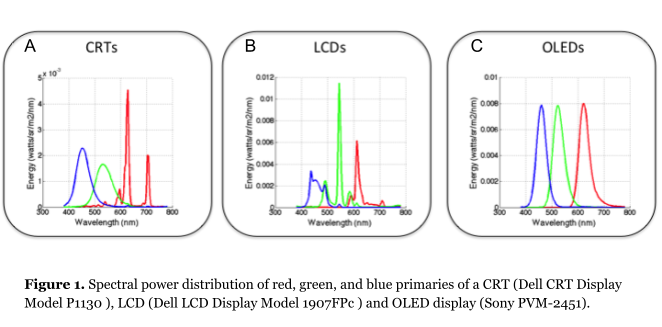
All modern color displays are designed with three types of subpixels whose spectral power distributions (SPD) peak in the long-, middle- and short-wavelength regions of the visible spectrum (Figure 1). Each type of subpixel is called a display primary and the whole mosaic is called a color channel. The relative SPD of each primary is designed to be invariant as its intensity changes (spectral homogeneity). In normal operation, the intensities of the three subpixels are set to match the color appearance of an experimental stimulus. Three primaries are used because human color-matching experiments show that subjects can match the color appearance of a wide range of spectral power distributions using the mixture of just three independent light sources (Maxwell, 1860; Wandell, 1995; Wyszecki & Stiles, 1982). Modern displays effectively comprise a very large number of color-matching experiments, one for each pixel in every frame.
The three main display technologies used in vision experiments today are CRTs (cathode ray tubes), LCDs (liquid-crystal displays) and OLEDs (organic light emitting diodes). Color CRTs were developed by RCA in the 1950s (Law, 1976) and were the nearly universal display technology for several decades. They remain an important display technology for vision researchers, although now they are rarely sold as consumer products. Invented at RCA labs in the 1970s (Kawamoto, 2002), LCDs were introduced as small mobile displays in digital watches, calculators and other handheld devices; later they enabled the widespread adoption of laptop computers. OLEDs were invented at Kodak in the 1980s (Tang & Vanslyke, 1987) and were first introduced as displays for digital cameras. Large OLED displays are expensive, but they have some advantages over LCDs: they achieve a deeper black and they have better temporal resolution.
In the realm of vision research, CRTs have long been valued for their ability to accurately control primary color intensities beyond 10 bits (Brainard et al., 2002), a critical feature for precise psychophysical experiments. The discontinuation of CRT mass production has led scientists to develop software solutions like ViewPixx and Display++ that enable researchers to achieve 10 bits of intensity resolution from LCD monitors (Ghodrati et al., 2015). In recent years, OLED displays have gained popularity due to their superior contrast ratios and higher refresh rates, making them ideal for experiments requiring precise temporal control and high-fidelity visual stimuli (Cooper et al., 2013).
Digital light projection (DLP) displays (Hornbeck, 1991) are spatial light modulators that use an array of small, deformable mirrors. They are not used widely in visual psychophysics. However, they have been adapted for use in studies of color constancy (Brainard, 1998; Brainard et al., 1997), in vitro primate retina intracellular recordings (Packer et al., 2001), and functional magnetic resonance imaging (Engel et al., 1997). The advantages of DLP technology, such as high contrast ratios, fast response times, MRI compatibility, and flexibility in stimulus presentation, have made it a useful tool in these specialized research applications.
MicroLEDs are a promising technology for the next-generation of displays (Jiang et al., 2002). At present, microLEDs are primarily used in compact displays for personal devices like smartwatches, smartphones, and head-mounted displays. Several manufacturers have demonstrated the capability to produce large-scale microLED displays, but widespread consumer adoption hinges on lowering manufacturing costs.
Cathode Ray Tubes (CRT)
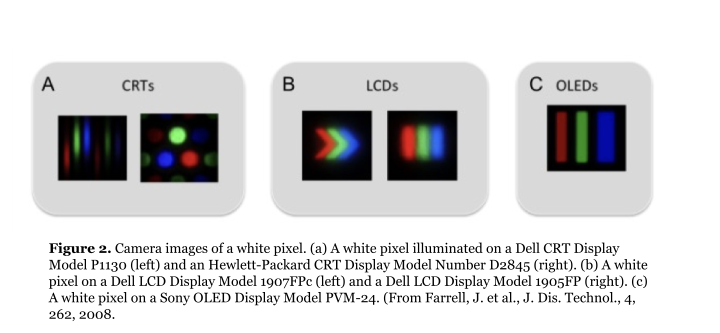
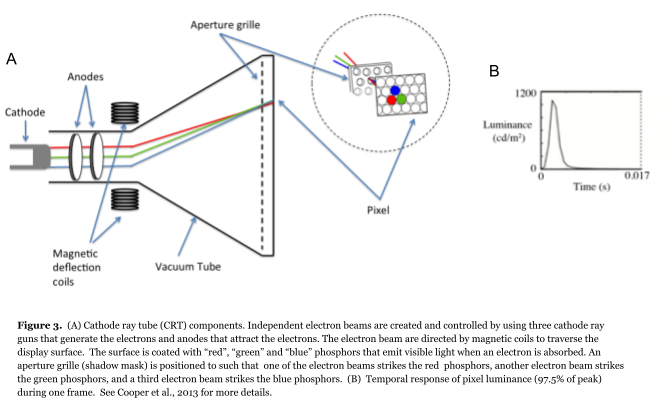
CRTs create light by directing an electron beam through a metal shadow mask onto one of three different types of phosphors (Castellano, 1992; Law, 1976). When irradiated by electrons, each of the phosphors emits light with a spectral radiance distribution that is unique to that phosphor. The CRT phosphors are painted on a transparent glass surface in a pattern of alternating dots or stripes (Figure 2A), and they are selected to emit predominantly in the long (red), middle (green) and short (blue) wavebands (Figure 1A). The amount of light from each type of phosphor is controlled by the intensity of the electron beam that is incident on the phosphor. The spatial properties of the display are determined by the size and spacing of the phosphor dots or stripes.
The temporal properties of the display are determined by the frequency with which each phosphor is stimulated by electrons and the rate at which the phosphorescence decays (see Figure 3B). The refresh rate is determined by how fast an electron beam can scan across the many rows of pixels in a display. The more rows there are, the more time it takes for the electron beam to return to the same phosphor dot. When the refresh rate is slow and the phosphor decay is fast, the display appears to flicker. Longer phosphor decay times reduce the visibility of flicker, but increase the visibility of motion blur (Becker, 2019; Farrell, 1986; Travis, n.d.; Y. Zhang et al., 2007).
In addition to scanning through many rows of pixels, the electron beam intensity modulates as the beam traverses phosphors within each row. The electron beam modulation rate, referred to as slew rate, is not fast enough to change perfectly as the beam moves between adjacent pixels. Consequently, the ability to control the light from adjacent pixels within a row is not perfectly independent (Lyons & Farrell, 1989). We will explain the consequence of this slew rate limitation on the use of a standard display model later in this chapter.
Liquid Crystal Displays
LCD displays function as an array of light valves, with each pixel regulating the amount of light transmitted from a constantly illuminated backlight. Traditional LCD backlights employ either a white fluorescent tube or a row of white LEDs positioned along the edge of the LC array, known as edge-lit configuration. In 2013, Sony introduced the first LCD television featuring a quantum dot (QD) backlight, a technology that has since become prevalent in most high-end displays and some laptops. An LCD QD backlight utilizes a row of blue LEDs that emit light through a film containing quantum dots. As the blue light traverses this quantum dot film, a portion is converted into red and green light, resulting in a combination that produces a white light that reportedly increases the color gamut of the LCD display (Luo et al., 2014; Xu et al., 2025). Regardless of the method used to create the white light, it is uniformly distributed across the display surface using diffusing and brightness-enhancing films, ensuring consistent illumination throughout the screen.
The backlight passes through a polarization filter, a layer of liquid crystal material, a second polarization filter, and then a color filter (Figure 4). The ability of photons to traverse this path is controlled by the alignment of the liquid crystals which determines the polarization of the photons and thus how much light passes through the two polarization filters. The state of the liquid crystal in each pixel is determined by an electric field that is controlled by digital values in a frame-buffer, under software control. Even when the liquid crystal is in a state that permits transmission (open), only a small fraction (about 3 percent) of the backlight photons pass through the two polarizers, color filter, and electronics.
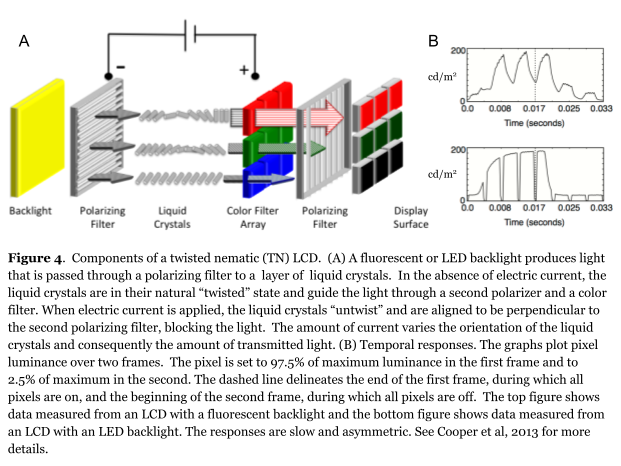
The spectral radiance of an LCD pixel is determined by the SPD of the backlight and the transmissivity of the optical elements (polarizers, LC, and color filters). The spatial properties of an LCD are determined by the dimensions of a panel of thin film transistors (TFT) that controls the voltage for each pixel component and the size and arrangement of each individual filter in the color filter array. The temporal properties of an LCD are determined by the modulation rate of the backlight and the temporal response of the liquid crystal (Yang & Wu, 2014). LCDs use sample and hold circuitry that keep the liquid crystals in their “open” or “closed” state (see Figure 4B). This means that flicker is not visible, but a negative consequence of the slow dynamics is that LCDs can produce visible motion blur. Furthermore, liquid crystals respond asymmetrically to an increase or decrease in voltage (changing the alignment of the liquid crystals). For example, it is often the case that a change from white to black is faster than a change from black to white. Some LCD manufacturers have introduced circuitry to “overdrive” and “undershoot” the voltage delivered to each pixel. This additional circuitry reduces the visible motion blur but makes it difficult for the user to have precise control in the timing of visual stimuli (Elze & Tanner, 2012).
Another limitation of LCDs is that in the “off” state, photons from the backlight still find their way through the filters to the viewer. Consequently, LCDs do not achieve a complete black background which limits their dynamic range. Manufacturers introduced LED backlit panels that can be locally dimmed in different regions. In this way, one portion of the image can be much brighter than another, and a portion of the display can be nearly black, extending the image dynamic range. Such LCD displays are difficult to use in calibrated experiments because of the proprietary software and control circuitry that can vary with the displayed image.
Digital light projectors
The digital light projector (DLP) display technology is a micro-electro-mechanical system (MEMS) consisting of an array of microscopically small mirrors arranged in a matrix on a semiconductor chip- one mirror for each pixel (Florence & Yoder, 1996; Younse, 1993). Each mirror is on the order of 15 microns in size, and the deformable mirror arrays can have many different formats (e.g., 4K, 1080p, etc.). Like the LCDs, this is a light valve technology. The system includes a constant backlight, and each mirror can be in one of two states: it either reflects the backlight photons towards or away from the viewer. A typical pixel can change states at a high rate (kilohertz), though some devices can change much faster.
The intensity at each pixel is controlled by varying the percentage of time the mirror is directing light towards the viewer. In the single-chip DLP, color is controlled using a rapidly spinning color wheel that interposes different color filters between the light source. The color wheel rotation is synchronized with the control signals sent to the chip. While most display technologies use subpixel primaries that are adjacent in space, the DLP color primaries are adjacent in time - a technique called field-sequential color. Some DLP devices include only three (red, green and blue) primaries, while others include a fourth (white or clear) primary. The white primary increases the maximum display brightness, but at the highest brightness levels the display has a vanishingly small color gamut (Kelley et al., 2009).
A problem with the single-chip DLP design is that field-sequential color can produce visible color artifacts when the eye moves rapidly across the image. High speed eye movements cause the sequential red, green and blue images to project to different retinal positions (X. Zhang & Farrell, 2003). A more expensive three-chip DLP design is often used in home and movie theatres. The three-chip design simultaneously projects red, green and blue images that are co-registered; hence, these DLPs do not produce the sequential color artifacts.
Organic Light emitting diodes (OLED)
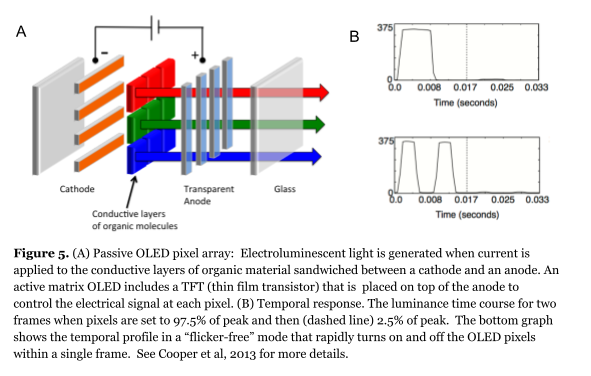
Conceptually, OLEDs are a much simpler display technology. Rather than being a light valve, each pixel in an OLED display is a light source, and thus they do not require a backlight. The device consists of two layers of organic molecules that are sandwiched between a cathode and an anode (Figure 5). OLED pixels emit light when an electric current is applied to the electroluminescent layer of organic molecules.
There are several ways to produce the different color primaries: (1) Each diode can be made from a different substance that emits light in a distinct wavelength band, (2) color filters can be placed in front of a single type of diode, or (3) a single type of OLED (usually blue) can be use to excite different types of phosphors (Tsujimura, 2017) or quantum dots (Fan et al., 2024). This is the same quantum dot technology that is used to create QD-LCD backlights, except that in this context, the red, green, and blue light sources serve as emissive pixels. A significant advantage of OLED displays is their ability to achieve a very high dynamic range, as each OLED pixel can be completely black. This characteristic allows for exceptional contrast and deep blacks in the displayed image.
The spatial properties of an OLED display are determined by the size and arrangement of the OLED pixels that are deposited onto glass. Today, OLED pixels can be as small as 10 micrometers but researchers are experimenting with OLEDs as small as 100 nanometers (Marcato et al., 2024). The OLED pixel size varies considerably depending on the type of display. For example, pixels can be 100 micrometers or larger on large format televisions. Some types of OLEDs (polymer OLEDs or PLEDs) can be printed onto plastic using a modified inkjet printer (Bale et al., 2006), or a 3D printer with a spray nozzle (Su et al., 2022). These advances in OLED fabrication techniques are driving progress in display technology, paving the way for higher resolutions, larger screens, and potentially novel form factors in future display applications (Singh et al., 2023).
The temporal properties of an OLED display are determined by the rate at which the pixel intensities can be changed (update rate) and the rate at which the screen is refreshed (refresh rate). OLEDs can be turned on and off extremely rapidly (update rate). Hence, the update rate limits the motion velocities that can be represented (Watson et al., 1986). To reduce the visibility of flicker and motion blur, OLEDs can be refreshed at a rate that exceeds the update rate (see Figure 5B). This method is referred to as “pulse-width modulation” (Dimigen & Stein, 2024).
MicroLEDs
MicroLED displays are a new generation of screen technology. The key difference from OLED displays is that MicroLEDs use inorganic materials like gallium nitride (GaN) rather than organic compounds. When current flows through these tiny LEDs, electrons combine with "holes" (areas lacking electrons) to produce light. The intensity of this light depends on how much current is delivered; this relationship isn't linear. The current delivered to each pixel in a MicroLED display is controlled by a thin-film transistor (TFT) in the display's backplane. MicroLEDs produce color primaries using the same methods as OLEDs - direct emission, color filters, or color conversion using quantum dots.
MicroLEDs offer several significant advantages compared to current OLED technology. Their lifespan is remarkably long, about 106 hours compared to OLEDs' 3 x 10⁴ hours. They're also approximately 1,000 times brighter and respond faster to electrical signals. Perhaps most impressively, MicroLEDs can be made very small, around 1 micrometer (Hsiang et al., 2021; Smith et al., 2020).
MicroLED technology is just appearing in consumer products, including near-eye displays (Bandari & Schmidt, 2024; Huang et al., 2020). Manufacturers have also successfully created large displays using this technology (MiniMicroLED, 2024). Companies are currently developing MicroLED displays for smartphones and virtual reality headsets. The main challenge now is reducing production costs to make these displays affordable.
The standard display model and stimulus characterization
Overview
Display technologies are differentiated by two main factors: the mechanism used to generate light and the spatial configuration of pixels and subpixels. When designing commercial displays, manufacturers prioritize various performance metrics such as energy efficiency, brightness, spatial resolution, contrast ratio (darkness), color gamut, and refresh/update rates. The relative importance of these parameters varies depending on the intended application.
Despite the diverse array of display architectures, it is possible to identify a few fundamental principles that describe the relationship between electronic control signals and the spectral radiance generated by a display. These widely adopted principles form the basis of a standard display model (Brainard et al., 2002; Post, 1992). This model is phenomenological in nature, meaning it describes observable relationships without necessarily explaining the underlying physical processes. Importantly, this standard display model is applicable not only to current popular displays but also to anticipated future developments in display technology.
The standard display model's parameters can be determined through a limited number of calibration measurements. The model, combined with the calibration data, enables precise control over the display's radiance output. A model is necessary because there are far too many images to calibrate individually (Brainard, 1989). To illustrate, an 8-bit display can produce 2^24 distinct RGB combinations for a single static image. Furthermore, a 1024x1024 pixel display (2^20 pixels) has the potential to render an astronomical 2^480 different images. The standard display model efficiently addresses this complexity by defining a compact set of calibration measurements, which can then be used to predict the spectral radiance for a wide array of images.
Several key measurements are necessary to specify a model for any particular display. First, each subpixel type has a characteristic spectral power distribution (SPD, Figure 1). The model assumes that the SPD is the same for all subpixels of a given type and is invariant when normalized for intensity level. Thus, the normalized SPD can be measured using a spectroradiometer that averages the spectral radiance emitted from a region of the display surface.
Second, the absolute level (peak radiance) of the SPD is set by the frame buffer value. The relationship between the frame buffer value and the SPD level is referred to as the gamma-curve. The gamma-curve is assumed to be the same for all subpixels of a given type (shift-invariant), independent of the image content, and monotone increasing.
Third, the standard display model describes the spatial distribution of light emitted by each type of subpixel, called the point spread function (PSF). The standard display model assumes that the PSF is the same for subpixels of a given type (shift-invariant) and independent of the image content.
Finally, most displays refresh the image (frame) at a rate between 30 and 240 times per second. Within each frame, the subpixel intensity can rise and fall, and the frame repetitions and pixel dynamics influence the visibility of motion and flicker. The standard display model assumes that each subpixel has a simple time-invariant impulse response function that is independent of image content. This assumption is frequently violated because of the extensive engineering to control the dynamics of displays (see previous sections on LCDs, CRTs and OLEDs). Characterizing the display dynamics is particularly important for experiments involving rapidly changing high contrast targets (e.g. random dots).
The standard display model clarifies the measurements needed to calibrate a display. The first two are to measure (a) the normalized spectral radiance distributions for each of the display primaries, and (b) the gamma-curve that specifies the absolute level of the spectral radiance given a particular frame buffer value. It is less common for scientists to measure the subpixel PSFs. These can be measured using a macro-lens and the linear output of a calibrated digital camera (Farrell et al., 2008), but in most cases the function is treated as a single point (impulse). Characterizing the PSF can be meaningful for measurements of fine spatial resolution (e.g., quality of fonts, vernier resolution) where there are significant effects of human optics on retinal image formation. In the next section, we offer specific advice about making these calibration measurements and combining them into a computational implementation of the standard display model.
Spectral radiance and gamma curves
It is common to use a spectral radiometer to measure the spectral radiance emitted by each of the three types of primaries. The standard display model assumes that for each primary the spectral power distribution takes the form  , where
  is the spectral power distribution of the display when the frame buffer is set to its maximum value and 0 <
  < 1 is the relative intensity for a frame buffer value of
  .
.
To estimate  and , we measure the spectral radiance for a series of different frame buffer levels. An important detail is this: In most displays there is some stray light present even when =0. This light is usually treated as a fixed offset,
  and subtracted from the calibration data (Brainard et al., 2002). Hence, the measured spectral radiance curves have the form

The term I is the relative intensity of the primary and is the frame buffer value. When is set to the maximum value, the value of I is equal to 1. If one subtracts the background spectral power distribution, then when  and the relative intensity is typically modeled as a simple power law (Poynton, 1993) which gives the curve its name.
 [1]
[1]
For most displays  is difficult to measure because it is small and negligible compared to the experimental stimuli. In such cases, the radiance is modeled by including a small, wavelength-independent, offset in the gamma curve
 [2]
[2]
 [3]
[3]
Historically, the value of ɣ in manufactured displays been between 1.8 and 2.4, which is quite significant. If one changes the ɣ of a display from 1.8 to 2.4, the same frame buffer values will produce very different spectral radiance distributions. Pixels set to the same frame buffer (R,G,B) produce spectral radiances that differ by as much as 10 CIELAB ΔE units (median ~ 6 ΔE). In recent years, manufacturers have converged to a function that is linear at small values, close toɣ = 2.4 at high values, and overall similar toɣ = 2.2.
The analytical gamma function is an approximation to the true . In modern computers, this approximation can be avoided by building a lookup table that stores the nonlinear relationship between the digital control values and the display output, .
This nonlinearity will continue across technologies because programmers prefer that equal spacing of the digital frame buffer values correspond to equal perceptual spacing (Poynton, 1993; Poynton & Funt, 2014). To preserve this perceptual relationship, the display intensity must be nonlinearly related to the frame buffer value (Stevens, 1957; Wandell, 1995).
The subpixel point spread functions
The spatial distribution of light from each subpixel is described by a point spread function,  . The spatial spread of the light from each subpixel can be measured using a high resolution digital camera with a close-up lens (Farrell et al., 2008). Furthermore, the spectral and spatial parts of the point spread function are separable.
 [4]
[4]
The subpixel point spread is assumed to have the same form across display positions, that is the subpixel point spread function at pixel (u,v) is  . And finally, the shape scales with intensity
  .
.
The standard display model assumes that point spread functions from adjacent pixels sum. This linearity is an ideal - no display is precisely linear. But display designs generally aim to satisfy these principles and implementations are close enough so that these principles are a good basis for display characterization and simulation.
Linearity
Apart from the static, nonlinear gamma curve, the standard display model is a shift-invariant linear system. That is, given the intensity of each subpixel we compute the expected display spectral radiance as the weighted sum of the subpixel point spread functions. If the subpixel intensities for one image are  with corresponding spectral radiance
  , and a second image is
  with corresponding spectral radiance
  , then the radiance when the image is
  will be
  .
.
The calibration process should test the additivity assumption. Simple tests include checking that the light emitted from the ith subpixel does not depend on the intensity of other subpixels (Farrell et al., 2008; Lyons & Farrell, 1989; Pelli, 1997).
Model summary
The standard display model for a steady-state image can be expressed as a simple formula that maps the frame buffer values, , to the display spatial-spectral radiance 
Suppose the gamma function, point spread function, and spectral power distribution of the jth subpixel type are  ,
,  , and
, and  . Suppose the frame buffer values for the jth subpixel type is
  . Then the display spectral radiance across space is predicted to be
 [5]
[5]
Display calibration
If the standard display model describes the device under test, then calibration requires a very small set of display measurements - gamma, spd, PSF and temporal response - to fully describe the physical radiance of displayed stimuli. Display calibration can be conceived as (a) measuring how well the key model assumptions hold (spectral homogeneity, pixel independence, spatial homogeneity), and (b) using the measurements to estimate the model parameters.
Pixel independence
The radiance emitted by a subpixel should depend only on the digital frame buffer value controlling that subpixel. Equivalently, the radiance emitted by a collection of pixels must not change as the digital values of other pixels change. Displays often satisfy this pixel independence principle for a large range of stimuli (Farrell et al., 2008), but there are displays and certain types of stimuli that fail this test (Elze & Tanner, 2012; Lyons & Farrell, 1989).
For example, CRTs must sweep the intensity of the electron beam very rapidly across each row of pixels. There are limits to how rapidly the beam intensity can change (a maximum “slew rate”). If a very different intensity is required for a pair of adjacent row pixels, the beam may not be able to adjust in time and independence is violated, and the standard display model will not be useful for characterizing the spatial-spectral radiance of such stimuli (Lyons & Farrell, 1989; Naiman & Makous, 1993).
LCDs are limited by the rate at which liquid crystals can change their state in response to a change in voltage polarity, as well as the asymmetry in their response to the “on” or “off” states. LCDs typically combine sample and hold circuitry to switch between different LC states and a flickering backlight to minimize the visibility of both motion blur. LCDs with these features (sample and hold circuitry with flickering LED or fluorescent backlights) can be modeled as a linear system (Farrell et al., 2008). Departure from display linearity occurs, however, when LCD manufacturers introduce “overdrive” and “undershoot” circuitry to minimize the visibility of motion blur or when they locally dim LED backlight panels to increase dynamic range. These new features make it very difficult to control and calibrate visual stimuli, particularly for studies that require precise control of timing (Elze & Tanner, 2012).
There are several ways to test pixel independence (Farrell et al., 2008; Lyons & Farrell, 1989; Pelli, 1997), but the general principle is simple. Separately measure the radiance from the middle of a large patch of pixels. Make the measurement with a few different digital values. Then create spatial patterns that are made up with half the pixels at one digital value and half at the other. The radiance from these mixed patches should be the average of the radiance from the large patches, measured individually.
A key assessment is to evaluate how well independence is satisfied for the planned experimental stimuli. For example, CRTs often fail pixel independence for high spatial frequency stimuli because of the finite slew rate of the electron beam. Nonetheless, CRTs are very useful for visual experiments that use low frequency stimuli, such as studies of human color vision. The standard display model, like any useful model, will have some compliance range, and the practical question is whether the model can be used given a specific experimental plan.
OLEDs are excellent devices for vision research because they can meet the requirements of the standard display model (Cooper et al., 2013). Display electronics control the rate at which the pixel intensities can be changed (the update rate), but OLED pixels can be rapidly turned on and off. Thus while the update rate limits the motion velocities that can be represented, the higher refresh rates minimize the visibility of motion blur and flicker. And, unlike the LCDs that modulate the intensity of a backlight, OLED pixels can be turned off, creating a very dark background.
Given these benefits, and the fact that the cost of manufacturing OLED displays is decreasing, one
might consider these displays to be ideal devices for vision research. There are, however, potential challenges to consider. OLED display manufacturers are experimenting with different types of color pixel patterns and developing proprietary methods for rendering images on these new displays. For instance, one manufacturer incorporated a hardware-based edge enhancement algorithm, though fortunately, this feature can be disabled to maintain pixel independence (Cooper et al., 2013). Unless it is possible to turn off or at least control the proprietary display rendering, which may vary depending on the presented image, it may be difficult to know the spatial distribution of the spectral energy in displayed stimuli.
Spectral homogeneity
The relative spectral radiance from a subpixel should be the same as its intensity is varied. Any change in the relative spectral radiance will be manifest as an unwanted color shift, and the display will be difficult to calibrate. Recall that the intensity of the light from an LC display depends on the rotation of the polarization angle caused by the birefringent liquid crystal. In some displays, the polarization effect is wavelength dependent and this violates the spectral homogeneity assumption (Wandell & Silverstein, 2003). These failure occurs because the LC polarization is not precisely
the same for all wavelengths and also as a result of spectral variations in polarizer extinction.
A second deviation from the standard display model occurs when the display emission is angle-dependent. In fact, the first-generation of LCDs had a very large angle-dependence so that even small changes in the viewing position had a large impact on the spectral radiance at the cornea. The reason for this strong dependence is that the path followed by a ray through the LC and the polarizers has an influence on the likelihood of transmission, and this function is wavelength dependent (Silverstein, L.D., Fiske, T.G., 1993). Manufacturers have reduced these viewing angle dependencies by placing retardation films in the optical path (Yakovlev et al., 2015).
For visual psychophysics experiments, it is typical to fix the subject’s head position relative to the screen, typically by using a chin-rest or a bite bar placed on-axis facing the middle of the display. Instruments used for display calibration should be placed at this position. If the spectrophotometer and the eye are located at any other angle, the spectral radiance from the display may different.
Spatial homogeneity (shift invariance)
When a subject is close to the display surface, the angle-dependence of the spectral radiance appears as a spatial inhomogeneity: the spectral radiance at the cornea differs between on-axis (center) and off-axis (edge) pixels. At further distances, say 1m away, the angle between the center and edge is smaller and the spatial homogeneity is better.
A second source of spatial inhomogeneity arises from the fact that it is difficult to maintain perfect uniformity of the pixels across the relatively large display surfaces. Such non-uniformities are referred to as “mura”, which is a Japanese word for “unevenness”. For LCDs, there are several sources of mura, including non-uniformity in the TFT thickness, LC material density, color filter variations, backlight illumination, and variations in the optical filters. Additional possible sources are impurities in the LC material, non-uniform gaps between substrates and warped light guides.
On LCDs, mura appears as blemishes and dark spots; manufacturers attempt to eliminate these sources during the manufacturing process. For OLEDs, mura is mainly due to non-uniformity in the currents in spatially adjacent diodes that appear as black lines, blotches, dots, and faint stains that are more visible in the dark areas of an image. This can be mitigated during the manufacturing process by introducing feedback circuitry that adjusts the pixel transistor current during a calibration procedure (McCreary, 2014).
Applications of the standard display model
The standard display model is a versatile tool in the fields of vision science and display engineering. Its primary functions can be summarized in three key areas. First, it serves as a guide for calibrating visual stimuli, which is essential for scientists to accurately characterize and share experimental stimuli, thereby facilitating the replication of scientific studies (Brainard, 1989; Brainard et al., 2002). Second, the model supports the advancement of computational models for human vision by enabling researchers to calculate the irradiance incident at the eye, a critical factor in understanding visual perception (Cottaris et al., 2019, 2020; X. Ding et al., 2019; Farrell et al., 2014). Third, it is valuable in the engineering design process, allowing for the simulation and evaluation of different display types and rendering algorithms (Farrell et al., 2008).
Key assumptions of the standard display model is that the lightgenerated by each display subpixel is additive, independent and shift invariant. These assumptions, referred to as spectral homogeneity, pixel independence and spatial homogeneity, can be tested in the calibration process. A particular display may not meet these conditions for all stimuli, yet the model may still be used to predict the spatial-spectral radiance of a restricted class of visual stimuli. As an example, the standard display model does not predict the spectral radiance of high frequency gratings presented on a CRT(Farrell et al., 2008; Lyons & Farrell, 1989; Pelli, 1997), but the model does predict the spectral-spectral radiance of large uniform colors(Brainard et al., 2002; Post, 1992). The standard display model can predict the steady-state spatial-spectral radiance of high frequency gratings and text rendered on many LCD displays(Farrell et al., 2008), particularly in the absence of complex circuitry to overdrive or undershoot pixel intensity(B.-W. Lee et al., 2001; S.-W. Lee et al., 2006) and locally dim LED backlights(Seetzen et al., 2004). The standard display can predict the spatial-spectral radiance of many visual stimuli rendered on OLED displays when image-adaptive edge enhancement algorithms that are typically implemented in hardware are disabled(Cooper et al., 2013).Even head-mounted displays (HMDs) which present unique challenges for calibration due to their proprietary rendering and updating software, can be modified so that spectral homogeneity and pixel independence are achievable(Gil Rodríguez et al., 2022; Toscani et al., 2019; Zaman et al., 2023).
In the following sections, we present two examples that illustrate how the standard model, coupled with color discrimination metrics, can analyze display capabilities. The first demonstrates the necessity of 10-bit intensity resolution for measuring psychophysical discrimination functions. The second analyzes the impact of different subpixel PSFs on font discriminations. These examples illustrate how the standard display model can be applied to analyze display capabilities under specific experimental conditions, highlighting its versatility and practical applications in display technology research and development.
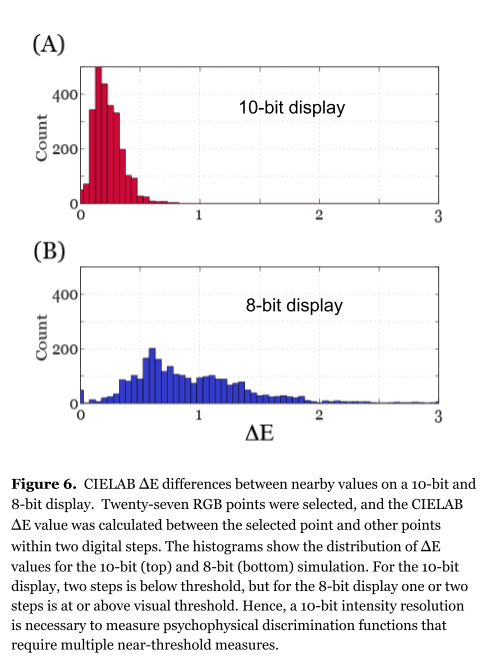
Color discriminations: the impact of bit-depth
First, we consider how the number of digital steps (frame buffer levels) limits the ability to make threshold color and luminance discrimination measurements. We calculated the CIE XYZ values for each of 27 different RGB levels, and we then calculated the CIELAB ΔE value between each of these 27 points and all of its neighbors within 2 digital steps. We repeated this calculation simulation assuming a frame buffer with 10-bits (1024 levels), the actual display resolution, and a coarser step size of 8-bits (256 levels) but equivalent gamma.
The distributions of CIELAB ΔE differences for the 10-bit and 8-bit displays are shown in the upper and lower histograms of Figure 6, respectively. For a 10-bit display, the signals within two digital steps are below ΔE=1. In this case, the visual discriminability is small enough to measure a psychophysical discrimination curve. If the display has only 8-bits of intensity resolution, the two digital steps frequently exceed ΔE=1. This explains why threshold measurements are impractical on 8-bit displays. For commercial purposes, however, one step is about ΔE=1, which explains why 8-bits renders a reasonable reproduction.
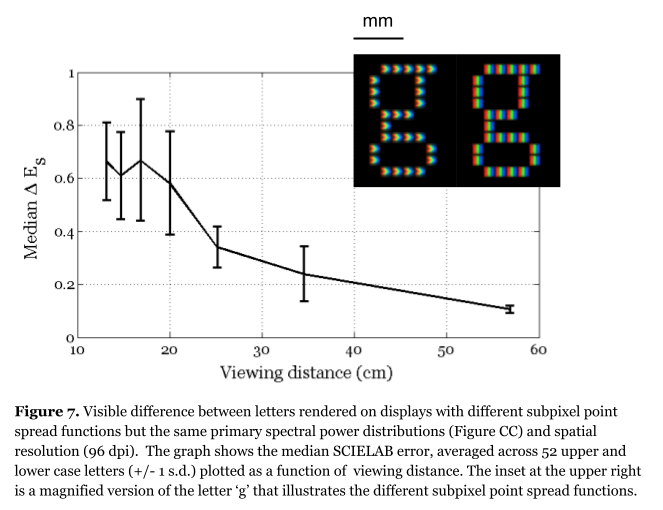
Spatial-spectral discriminations
Next, we analyzed the visual impact of changing the subpixel point spread function (see Figure 2). In this example, we compared two displays with the same primaries and spatial resolution (96 dots per inch), but with different pixel point spread functions. In one case, the point spread function is the conventional set of three parallel stripes (Dell LCD Display Model 1905FP), while in the second case the point spread is three adjacent chevrons (Dell LCD Display Model 1907FPc). We used the standard display model to calculate the spatial-spectral radiance of the 52 upper and lower case letters on both displays. The spatial-spectral radiance image data are represented as 3D matrices or hypercubes where each plane in the hypercube contains the stimulus intensity for points sampled across the display (x,y) for each of the sampled wavelengths (ƛ). To visualize the data, we map the vector describing the spectral radiance for each pixel into CIE XYZ values and convert these into sRGB display values(see inset in Figure 7).
We used the spatial-spectral radiance data to calculate the Spatial CIELAB (S-CIELAB) ΔE difference(Zhang & Wandell, 1997) between each letter simulated on the two displays and viewed from different distances. Figure 7 plots themedian S-CIELAB ΔE value as a function of viewing distance. The analysis predicts no visible differences between pairs of letters rendered on the two displays at any of the viewing distances. And indeed, we did not find significant differences between subject’s judgments about the quality of letters rendered on the two different displays (Farrell et al., 2009).
The future: Display systems and simulation
The standard display model is used in vision science in two important ways. First, it is used to control and characterize the stimuli used in visual psychophysical experiments. Second, it is used to calculate the irradiance at the eye and integrated into computational models of human vision[1].
A third use of the standard display model, which is important for industry, is its use in simulation to soft prototype displays and quantify their performance. Simulation is a powerful tool in the imaging industry and an important part of our own research[2]. Many research groups and companies are developing simulation software to support the design of imaging components including lenses, sensors and light-emitting devices. Soft prototyping is used to evaluate the integration of those components into imaging systems. Similarly, the standard display model will need to evolve and be integrated into image systems simulation software as displays become an integral part of more complex imaging systems.
To understand the evolution of display imaging systems, it's helpful to consider the concept of the environmental light field—a complete radiometric description of light rays within a three-dimensional scene. Recreating this full light field is a significant challenge, currently beyond our technological capabilities. An ideal system would emit light rays with precise intensity, direction, and wavelength from every point within a large volume, effectively replicating how light propagates from a real 3D scene. This approach promises accurate depth cues—including focus, parallax, and occlusion—allowing viewers to perceive lifelike 3D images without special glasses or head tracking, a key objective for many display technology researchers and engineers.
Free-standing displays approximate portions of the environmental light field. Early systems, primarily for teleconferencing, were expensive and complex. Commercial examples included life-size displays with ultra-high definition (e.g., Cisco TelePresence, Poly RealPresence, Google’s Project Starline), designed to present remote participants at their actual size. Some used curved or wrap-around displays for greater immersion, attempting a better approximation of the light field. More recent displays offer a closer approximation of the light field (Wang et al., 2024) within a volume of space (e.g., Holografika, Light Field Lab, Leia). These systems integrate optics with light generation to control the intensity, color, and direction of emitted rays. The light field itself can be generated using computer graphics or captured with a light field camera (e.g., Raytrix). These are often referred to as "far-field" displays.
An alternative approach uses simpler displays but dynamically updates the image based on the viewer's head and eye position. The development of small displays like OLEDs and microLEDs has enabled compact, wearable "near-field" displays in the form of glasses or goggles. These systems use information about both the environmental light field and the viewer's head and eye position. A computer then calculates and renders the appropriate display image. This approach was pioneered in virtual reality (VR) devices and is now being developed for augmented reality (AR) and mixed reality (MR) (e.g., Apple’s Vision Pro, Meta’s Quest Pro). The near-field devices involve integration between many different sensors and extensive computation, along with highly specialized optics (Y. Ding et al., 2023; Rolland & Goodsell, 2024) to enable viewing the image on the small, near display. For example, the Apple Vision Pro includes twenty different sensors, a micro-OLED display with 23 million pixels and custom optics, and an M2 processor[3] .
Future display development will likely explore both far-field devices, aiming to present a larger portion of the environmental light field, and near-field devices, focusing on dynamically updating the incident light field. However, the near-field devices must address two key human factors challenges: the vergence-accommodation conflict (VAC) and latency (Bhowmik, 2024; Jerald, 2015; Kramida, 2016).
The VAC arises from a mismatch between vergence and accommodation, two normally coupled eye responses. In natural vision, our eyes converge (or diverge) to fixate on an object, and simultaneously adjust focus (accommodate) to maintain a sharp image. In most stereoscopic displays, however, the eyes are always focused on the fixed display plane, regardless of the virtual object's apparent distance. This creates a conflict: while the eyes verge to align with virtual objects at varying depths, accommodation remains fixed at the screen distance. This unnatural decoupling can lead to visual discomfort, eye strain, and difficulty fusing stereoscopic images, especially for near objects. Latency, the delay between user head/eye movements and corresponding display updates, can disrupt presence and induce motion sickness.
Addressing the vergence-accommodation conflict (VAC) and latency requires close collaboration between engineering and vision science researchers. Implementing and evaluating both far- and near-field displays necessitates new approaches to device calibration, characterization, and understanding the impact of engineering design choices on the appearance. The standard display model will likely be replaced by sophisticated simulation software capable of modeling each system component, including light-emitting elements, light guides, and various optical components. Increased emphasis will be placed on precise timing to understand latency requirements. This will enable prediction of the dynamic light field generated by these displays and, consequently, the irradiance at the viewer’s retinas. This shift from a standard display model to comprehensive system simulation demands new ideas in both vision science and display technology. We are confident that scientists and engineers will develop robust calibration and simulation methodologies, enabling researchers to effectively integrate these new technologies into scientific practice and generate novel insights into vision and cognition.
References
Bale, M., Carter, J. C., Creighton, C. J., Gregory, H. J., Lyon, P. H., Ng, P., Webb, L., & Wehrum, A. (2006). Ink‐jet printing: The route to production of full‐color P‐OLED displays.Journal of the Society for Information Display,14(5), 453–459.
Bandari, V. K., & Schmidt, O. G. (2024). A bright future for micro-LED displays.Light, Science & Applications,13(1), 317.
Becker, M. E. (2019). 50‐1: Flicker from electronic displays ‐ reconsidering the confusion.Digest of Technical Papers. SID International Symposium,50(1), 687–690.
Bhowmik, A. K. (2024). Virtual and augmented reality: Human sensory‐perceptual requirements and trends for immersive spatial computing experiences.Journal of the Society for Information Display,32(8), 605–646.
Brainard, D. H. (1989). Calibration of a computer controlled color monitor.Color Research and Application,14(1), 23–34.
Brainard, D. H. (1998). Color constancy in the nearly natural image. 2. Achromatic loci.Journal of The Optical Society of America A-Optics Image Science and Vision,15(2), 307–325.
Brainard, D. H., Brunt, W. A., & Speigle, J. M. (1997). Color constancy in the nearly natural image. 1. Asymmetric matches.JOSA A,14(9), 2091–2110.
Brainard, D. H., Pelli, D. G., & Robson, T. (2002). Display characterization.Signal Processing Algorithms, Architectures, Arrangements, and Applications Conference Proceedings,80, 2–067.
Castellano, J. A. (1992).Handbook of display technology.https://books.google.com/books?hl=en&lr=&id=p68XfA0MHpoC&oi=fnd&pg=PR13&dq=+Handbook+Of+Display+Technology+Castellano&ots=yt-mSACsLQ&sig=pQWBgKMXlbNGo-Z6iZwydyCAkJY
Cooper, E. A., Jiang, H., Vildavski, V., Farrell, J. E., & Norcia, A. M. (2013). Assessment of OLED displays for vision research.Journal of Vision,13(12), 16.
Cottaris, N. P., Jiang, H., Ding, X., Wandell, B. A., & Brainard, D. H. (2019). A computational-observer model of spatial contrast sensitivity: Effects of wave-front-based optics, cone-mosaic structure, and inference engine.Journal of Vision,19(4), 8.
Cottaris, N. P., Wandell, B. A., Rieke, F., & Brainard, D. H. (2020). A computational observer model of spatial contrast sensitivity: Effects of photocurrent encoding, fixational eye movements, and inference engine.Journal of Vision,20(7), 17.
Dimigen, O., & Stein, A. (2024). A high-speed OLED monitor for precise stimulation in vision, eye-tracking, and EEG research. InbioRxiv. https://doi.org/10.1101/2024.09.13.612866
Ding, X., Radonjic, A., Cottaris, N. P., Jiang, H., Wandell, B. A., & Brainard, D. H. (2019). Computational-observer analysis of illumination discrimination.Journal of Vision,19(7), 11.
Ding, Y., Yang, Q., Li, Y., Yang, Z., Wang, Z., Liang, H., & Wu, S.-T. (2023). Waveguide-based augmented reality displays: perspectives and challenges.eLight,3(1), 1–34.
Elze, T., & Tanner, T. G. (2012). Temporal properties of liquid crystal displays: implications for vision science experiments.PloS One,7(9), e44048.
Engel, S. A., Glover, G. H., & Wandell, B. A. (1997). Retinotopic organization in human visual cortex and the spatial precision of functional MRI.Cerebral Cortex (New York, N.Y.: 1991),7(2), 181–192.
Fan, J., Han, C., Yang, G., Song, B., Xu, R., Xiang, C., Zhang, T., & Qian, L. (2024). Recent progress of quantum dots light-emitting diodes: Materials, device structures, and display applications.Advanced Materials (Deerfield Beach, Fla.),36(37), e2312948.
Farrell, J. E. (1986). An analytical method for predicting perceived flicker.Behaviour & Information Technology,5(4), 349–358.
Farrell, J. E., Jiang, H., Winawer, J., Brainard, D. H., & Wandell, B. A. (2014). 27.2:distinguished paper: Modeling visible differences: The computational observer model.Digest of Technical Papers. SID International Symposium,45(1), 352–356.
Farrell, J. E., Ng, G., Ding, X., Larson, K., & Wandell, B. A. (2008). A display simulation toolbox for image quality evaluation.Journal of Display Technology,4(2), 262–270.
Farrell, J. E., Xu, J., Larson, K., & Wandell, B. A. (2009). 47.2: Visual preference for ClearType technology.Digest of Technical Papers. SID International Symposium,40(1), 702–705.
Florence, J. M., & Yoder, L. A. (1996). Display system architectures for digital micromirror device (DMD)-based projectors. In M. H. Wu (Ed.),Projection Displays II. SPIE. https://doi.org/10.1117/12.237004
Gershun, A. (1939). The Light Field.Journal of Mathematics and Physics,18(1-4), 51–151.
Ghodrati, M., Morris, A. P., & Price, N. S. C. (2015). The (un)suitability of modern liquid crystal displays (LCDs) for vision research.Frontiers in Psychology,6, 303.
Gil Rodríguez, R., Bayer, F., Toscani, M., Guarnera, D. ’ya, Guarnera, G. C., & Gegenfurtner, K. R. (2022). Colour Calibration of a Head Mounted Display for Colour Vision Research Using Virtual Reality.SN Computer Science,3(1), 22.
Hornbeck, L. J. (1991). Spatial light modulator and method (USPTO Patent No. 5061049). InUS Patent (No. 5061049).https://patents.google.com/patent/US5061049A/en
Hsiang, E.-L., Yang, Z., Yang, Q., Lan, Y.-F., & Wu, S.-T. (2021). Prospects and challenges of mini‐LED, OLED, and micro‐LED displays.Journal of the Society for Information Display,29(6), 446–465.
Huang, Y., Hsiang, E.-L., Deng, M.-Y., & Wu, S.-T. (2020). Mini-LED, Micro-LED and OLED displays: present status and future perspectives.Light, Science & Applications,9(1), 105.
Jerald, J. (2015).The VR book: Human-centered design for virtual reality. ACM Books.https://www.google.com/books/edition/The_VR_Book/ZEBiDwAAQBAJ?hl=en&gbpv=1&dq=Jason+Jerald&pg=PR11&printsec=frontcover
Jiang, H., Lin, J., Jin, S., & Li, J. (2002). Micro-size LED and detector arrays for minidisplay, hyper-bright light emitting diodes, lighting, and UV detector and imaging sensor applications (USPTO Patent No. 6410940). InUS Patent (No. 6410940).https://patents.google.com/patent/US6410940B1/en
Kawamoto, H. (2002). The history of liquid-crystal displays.Proceedings of the IEEE. Institute of Electrical and Electronics Engineers,90(4), 460–500.
Kelley, E. F., Lang, K., Silverstein, L. D., & Brill, M. H. (2009).17.5: Projector Flux from Color Primaries.https://www.nist.gov/publications/projector-flux-color-primaries
Kramida, G. (2016). Resolving the vergence-accommodation conflict in head-mounted displays.IEEE Transactions on Visualization and Computer Graphics,22, 1912–1931.
Law, H. B. (1976). The shadow mask color picture tube: How it began—An eyewitness account of its early history.IEEE Transactions on Electron Devices,23(7), 752–759.
Lee, B.-W., Park, C., Kim, S., Jeon, M., Heo, J., Sagong, D., Kim, J., & Souk, J. (2001). 51.2: Reducing gray‐level response to one frame: Dynamic Capacitance Compensation.Digest of Technical Papers. SID International Symposium,32(1), 1260–1263.
Lee, S.-W., Kim, M., Souk, J. H., & Kim, S. S. (2006). Motion artifact elimination technology for liquid‐crystal‐display monitors: Advanced dynamic capacitance compensation method.Journal of the Society for Information Display,14(4), 387–394.
Luo, Z., Xu, D., & Wu, S.-T. (2014). Emerging Quantum-Dots-Enhanced LCDs.Journal of Display Technology,10(7), 526–539.
Lyons, N. P., & Farrell, J. E. (1989). Linear systems analysis of CRT displays.SID Digest,10, 220–223.
Marcato, T., Oh, J., Lin, Z.-H., Shivarudraiah, S. B., Kumar, S., Zeng, S., & Shih, C.-J. (2024). Nanomolecular OLED Pixelization Enabling Electroluminescent Metasurfaces. InarXiv [physics.optics]. arXiv.http://arxiv.org/abs/2404.05336
Maxwell, J. C. (1860). IV. On the theory of compound colours, and the relations of the colours of the spectrum.Philosophical Transactions of the Royal Society of London,150(0), 57–84.
McCreary, J. L. (2014). Correction of TFT non-uniformity in AMOLED display (USPTO Patent No. 8624805). InUS Patent (No. 8624805).https://patents.google.com/patent/US8624805B2/en
MiniMicroLED, D. (2024, May 15). Highlights Of Micro LED Innovations At 2024 SID Display Week.Mini/MicroLED Insights | Shaping the Future of Mini & Micro LED Displays.https://www.minimicroled.com/2024-sid-display-week-highlights-of-micro-led-innovations-from-12-companies/
Naiman, A. C., & Makous, W. (1993). Undetected gray strips displace perceived edges nonlinearly.Journal of the Optical Society of America. A, Optics and Image Science,10(5), 794–803.
Packer, O., Diller, L. C., Verweij, J., Lee, B. B., Pokorny, J., Williams, D. R., Dacey, D. M., & Brainard, D. H. (2001). Characterization and use of a digital light projector for vision research.Vision Research,41(4), 427–439.
Pelli, D. G. (1997). Pixel independence: measuring spatial interactions on a CRT display.Spatial Vision,10(4), 443–446.
Post, D. L. (1992). Colorimetric measurement, calibration, and characterization of self-luminous displays. InColor in Electronic Displays (pp. 299–312). Springer US.
Poynton, C. (1993). Gamma and its disguises : The nonlinear mappings of intensity in perception, CRTs, film, and video.Smpte Journal,102, 1099–1108.
Poynton, C., & Funt, B. (2014). Perceptual uniformity in digital image representation and display.Color Research and Application,39(1), 6–15.
Rolland, J. P., & Goodsell, J. (2024). Waveguide-based augmented reality displays: a highlight.Light, Science & Applications,13(1), 22.
Seetzen, H., Heidrich, W., Stuerzlinger, W., Ward, G., Whitehead, L., Trentacoste, M., Ghosh, A., & Vorozcovs, A. (2004). High dynamic range display systems.ACM Transactions on Graphics,23(3), 760–768.
Silverstein, L.D., Fiske, T.G. (1993). Colorimetric and photometric modeling of liquid crystal displays.Color and Imaging Conference. Vol. 1993. No. 1. Color and Imaging Conference., Scottsdale, AZ.https://library.imaging.org/admin/apis/public/api/ist/website/downloadArticle/cic/1/1/art00038
Singh, L., Dubey, R., & Rai, R. N. (2023).Organic light emitting diode (OLED) toward smart lighting and displays technologies: Material design strategies, challenges and future perspectives (L. Singh, R. Dubey, & R. N. Rai (eds.)). CRC Press.https://books.google.com/books?hl=en&lr=&id=TqMIEQAAQBAJ&oi=fnd&pg=PP1&dq=Organic+Light+Emitting+Diode+(OLED)+Toward+Smart+Lighting+and+Displays+Technologies&ots=44pGRTvA2V&sig=80HUNiFW_xl0giEpVt2YdscHB30
Smith, J. M., Ley, R., Wong, M. S., Baek, Y. H., Kang, J. H., Kim, C. H., Gordon, M. J., Nakamura, S., Speck, J. S., & DenBaars, S. P. (2020). Comparison of size-dependent characteristics of blue and green InGaN microLEDs down to 1μ m in diameter.Applied Physics Letters,116(7), 071102.
Stevens, S. S. (1957). On the psychophysical law.Psychology Review,64(3), 153–181.
Su, R., Park, S. H., Ouyang, X., Ahn, S. I., & McAlpine, M. C. (2022). 3D-printed flexible organic light-emitting diode displays.Science Advances,8(1), eabl8798.
Tang, C., & Vanslyke, S. (1987). Organic Electroluminescent Diodes.Applied Physics Letters,51, 913–915.
Toscani, M., Gil, R., Guarnera, D., Guarnera, G., Kalouaz, A., & Gegenfurtner, K. R. (2019). Assessment of OLED head mounted display for vision research with virtual reality.2019 15th International Conference on Signal-Image Technology & Internet-Based Systems (SITIS), 738–745.
Travis, D. (n.d.).ISO 9241: Part 3. Retrieved December 30, 2024, fromhttps://www.userfocus.co.uk/resources/iso9241/part3.html?t
Tsujimura, T. (2017).OLED Display Fundamentals and Applications (2nd ed.) [PDF]. John Wiley & Sons.
Wandell, B. A. (1995).Foundations of vision: Behaviour, neuroscience, and computation. Sinauer Associates.
Wandell, B. A., & Silverstein, L. D. (2003). Digital Color Reproduction. InThe Science of Color (Vol. 2, pp. 281–316). Elsevier.
Wang, T., Yang, C., Chen, J., Zhao, Y., & Zong, J. (2024). Naked-eye light field display technology based on mini/micro light emitting diode panels: a systematic review and meta-analysis.Scientific Reports,14(1), 24381.
Watson, A. B., Ahumada, A., Jr, & Farrell, J. E. (1986). Window of visibility: a psychophysical theory of fidelity in time-sampled visual motion displays.Journal of the Optical Society of America A,3(3), 300–307.
Wyszecki, G., & Stiles, W. S. (1982).Color science (Vol. 8). Wiley New York.
Xu, B., Zhou, J., Zhang, C., Chang, Y., & Deng, Z. (2025). Research progress on quantum dot-embedded polymer films and plates for LCD backlight display.Polymers,17(2), 233.
Yakovlev, D. A., Chigrinov, V. G., & Kwok, H.-S. (2015).Modeling and optimization of LCD optical performance: Yakovlev/modeling (D. A. Yakovlev, V. G. Chigrinov, & H.-S. Kwok (eds.); 1st ed.) [PDF]. Wiley-Blackwell.
Yang, D.-K., & Wu, S.-T. (2014).Fundamentals of liquid crystal devices (2nd ed.) [EPUB]. Wiley-Blackwell.
Younse, J. (1993). Mirrors on a chip.IEEE Spectrum,30, 27–31.
Zaman, N., Sarker, P., & Tavakkoli, A. (2023). Calibration of head mounted displays for vision research with virtual reality.Journal of Vision,23. https://doi.org/10.1167/jov.23.6.7
Zhang, X., & Farrell, J. E. (2003). Sequential color breakup measured with induced saccades. In B. E. Rogowitz & T. N. Pappas (Eds.),Human Vision and Electronic Imaging VIII. SPIE. https://doi.org/10.1117/12.497843
Zhang, X., & Wandell, B. A. (1997). A spatial extension of CIELAB for digital color‐image reproduction.Journal of the Society for Information Display,5(1), 61–63.
Zhang, Y., Song, W., & Teunissen, K. (2007). A tradeoff between motion blur and flicker visibility of electronic display devices. In L. Zhou (Ed.),International Symposium on Photoelectronic Detection and Imaging 2007: Related Technologies and Applications. SPIE. https://doi.org/10.1117/12.790748
[1] https://github.com/isetbio/isetbio/wiki
[2] https://github.com/iset/isetcam/wiki
[3] https://www.apple.com/apple-vision-pro/specs/